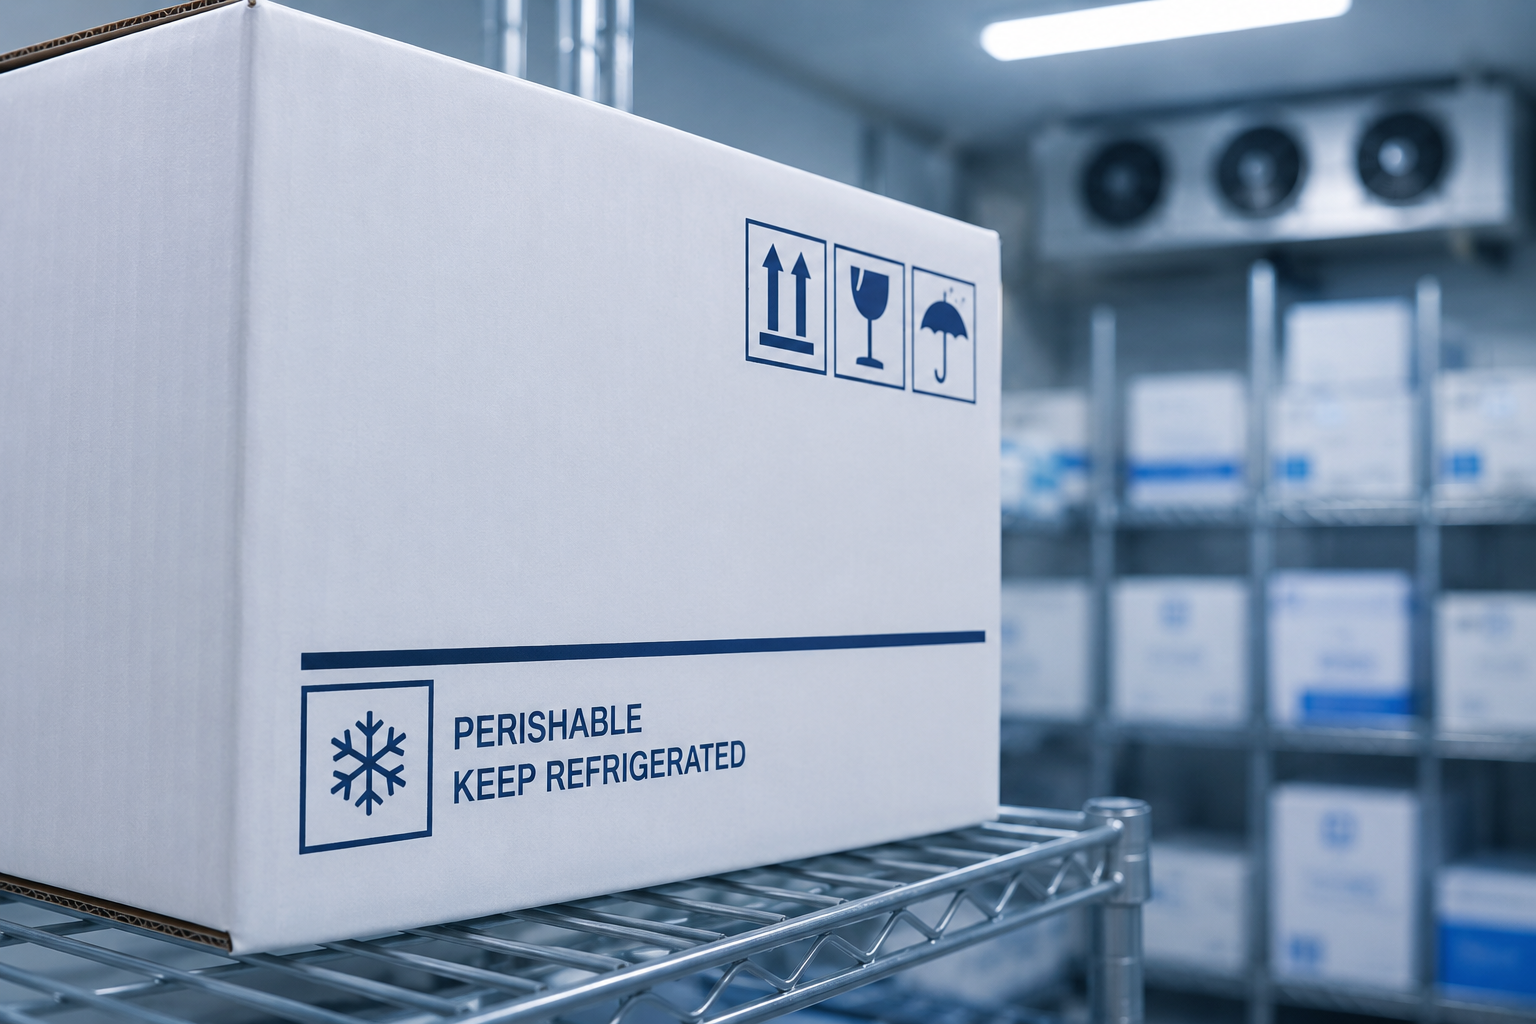

Dans un entrepôt frigorifique, la température n’est jamais parfaitement homogène. Des zones plus chaudes, des points froids, des variations liées aux ouvertures de portes ou à la charge : autant de facteurs qui peuvent compromettre la qualité des produits stockés. Le mapping thermique est l’outil qui permet de cartographier ces variations et de prouver que votre entrepôt maîtrise réellement sa chaîne du froid.
What is cold store mapping?
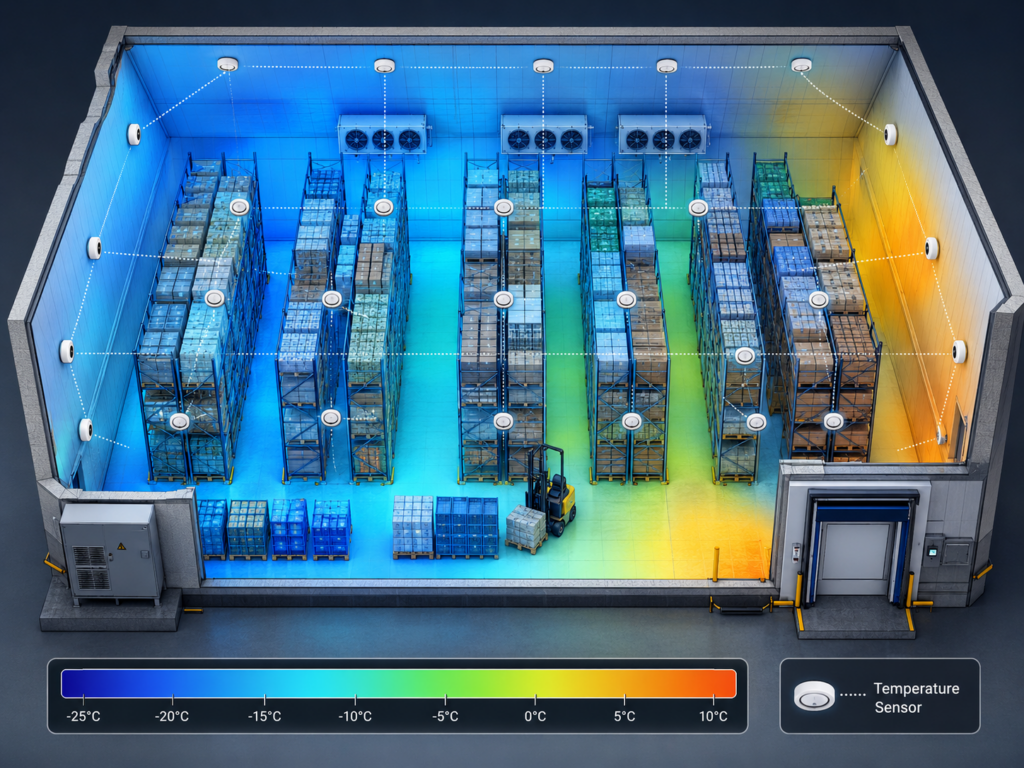
Thermal mapping, or thermal qualification, is a study that involves measuring the temperature at several points within a cold store simultaneously over a defined period. The aim is twofold: to identify high-risk areas and to document that storage conditions comply with regulatory requirements.
In practical terms, temperature loggers are strategically placed throughout the warehouse, taking into account the volume, the layout of the racking, heat sources and air intake areas. The data collected enables an accurate thermal map of the space to be drawn up
Who is concerned?
Thermal mapping is a regulatory requirement for all organisations that store products whose quality depends on maintaining a controlled temperature.
In the pharmaceutical sector, the EMA’s Good Distribution Practices (GDP) require an initial qualification of all storage areas, as well as regular re-qualifications. An unqualified warehouse exposes its operator to the risk of non-compliance during a regulatory audit.
In the food industry, European regulations and standards such as the IFS and the BRC also require documented control of storage conditions.
When should you carry out mapping?
A thermal mapping exercise is not a one-off task. It must be carried out in a number of different situations:
- When commissioning a new warehouse or cold store, before storing any sensitive products.
- Following major works or changes to the infrastructure.
- When replacing refrigeration equipment.
- At regular intervals as defined in your quality management system, usually once a year or once every two years, depending on the requirements of your sector.
- After any significant temperature fluctuations that may have affected storage conditions.
How is a mapping study carried out?
1. Definition of the protocol
Before any deployment, a protocol is drawn up. It sets out the number of measurement points, their locations, the duration of the study, the conditions to be tested (empty warehouse, loaded warehouse, summer, winter) and the acceptance criteria
2. Positioning of the loggers
Temperature loggers are positioned according to a predefined grid: the corners of the warehouse, the centre, areas near the doors, and high and low points. The number of sensors depends on the volume of the space and the applicable regulatory requirements.
3. Data collection
The study usually lasts between 24 hours and several days, depending on the protocol. The data loggers continuously record temperature variations throughout the entire period.
4. Analysis and report
The data is extracted and analysed. The final report identifies critical areas, confirms or otherwise the warehouse’s compliance, and recommends corrective action where necessary. This report serves as your documentary evidence in the event of an audit.
Les erreurs fréquentes à éviter
Carrying out thermal mapping solely under ideal conditions, without simulating door openings or load variations, distorts the results. Similarly, using uncalibrated data loggers renders the entire study invalid from a regulatory perspective. Another common pitfall is neglecting to re-qualify the system following modifications. A change in equipment or racking configuration can significantly alter the thermal map of a space.
The role of data loggers in mapping
The reliability of a mapping exercise depends directly on the quality of the data loggers used. They must be calibrated, certified and capable of providing data that can be used for the regulatory report.
Kelvin Solutions’ Innolog™ is designed for this type of study: it records up to 16,000 measurement points, automatically generates a PDF report upon completion, and comes with a calibration certificate that complies with GDP requirements. Several units can be deployed simultaneously throughout a warehouse to cover all the required measurement points.
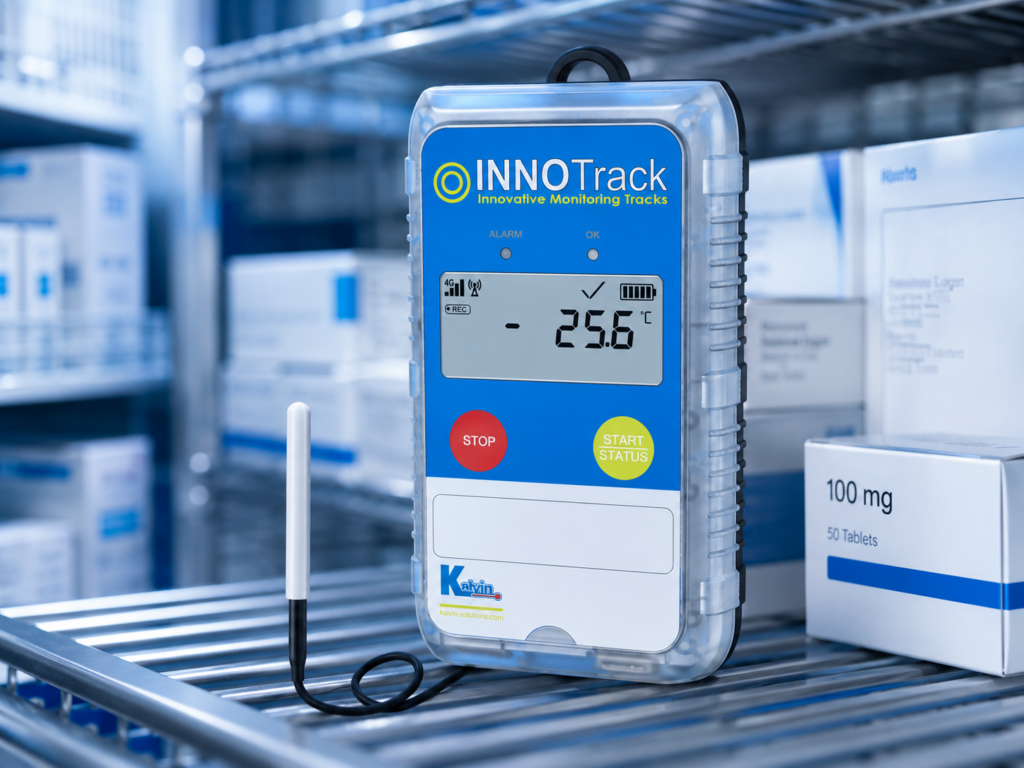
Pour les entrepôts nécessitant une surveillance en temps réel pendant l’étude, l’Innotrack™ permet de suivre en direct les données de chaque capteur et d’être alerté immédiatement en cas d’anomalie, sans attendre la fin de la période de mesure.